
The SDG Report Card 2018: A Reality Check
by Yash Saboo July 9 2018, 4:49 pm Estimated Reading Time: 2 mins, 22 secsIt is indeed true that the World Bank is one of the world’s largest producers of development data and research. Following the World Report 2018, World Bank has released the 2018 Atlas of Sustainable Development Goals. With over 180 maps and charts, the newest publication shows the progress the world is making towards United Nation's 17 Sustainable Development Goals, popularly known as SDGs.
For those who aren't aware, The Sustainable Development Goals (SDGs), otherwise known as the Global Goals, are a universal call to action to end poverty, protect the planet and ensure that all people enjoy peace and prosperity.
These 17 Goals build on the successes of the Millennium Development Goals while including new areas such as climate change, economic inequality, innovation, sustainable consumption, peace and justice, among other priorities. The goals are interconnected – often the key to success on one will involve tackling issues more commonly associated with another. The SDGs work in the spirit of partnership and pragmatism to make the right choices now to improve life, in a sustainable way, for future generations. They provide clear guidelines and targets for all countries to adopt in accordance with their own priorities and the environmental challenges of the world at large.
The Atlas uses over 1,400 World Development Indicators, which include data from up to 50 years ago. The Atlas also leverages new and developing data, especially as the UN’s global SDG indicator framework continues to be refined.
Data discussions often highlight the need to move beyond national averages to identify groups “left behind.” The Atlas features local and disaggregated data, showing, for example, sub-national data on air quality in China. Where possible, it shows city-level variations in pollutants to paint a more detailed picture of progress towards SDG 13 (climate action) and SDG target 11.6 on air quality in cities.
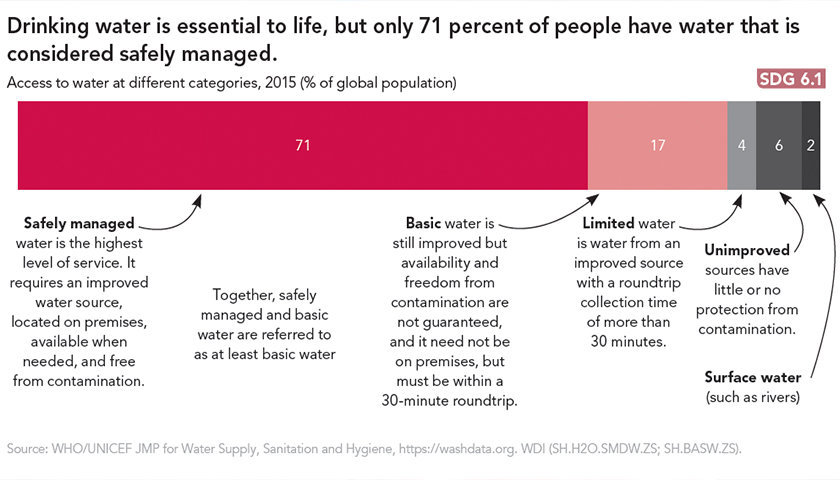
In addition to trends, the Atlas discusses measurement issues. For example, new, more granular definitions of access to water and sanitation presented in SDG6 show that while almost 90 percent of the world has access to “at least basic” water - only 71 percent of access water that’s considered “safely managed”, being both readily available and free from contamination.
SDG Atlas
The publication looks at each of the 17 SDGs to identify trends in progress to date and where efforts need to be focused. Much of the data analyzed is from before 2015, and the Atlas’s graphics show trends from as early as the 1960s.
While the publication distills and visualizes economic, social and environmental progress mapped to the SDGs, targets and indicators, it is not necessarily intended to measure the extent to which each target has been achieved, the authors note; it is not a scorecard. In some cases, time series data shows historical trends, whereas, in others, a more static picture is presented to reveal gaps and outstanding needs.


-173X130.jpg)
-173X130.jpg)
-173X130.jpg)
-173X130.jpg)
-173X130.jpg)
-173X130.jpg)
_(1)-173X130.jpg)
